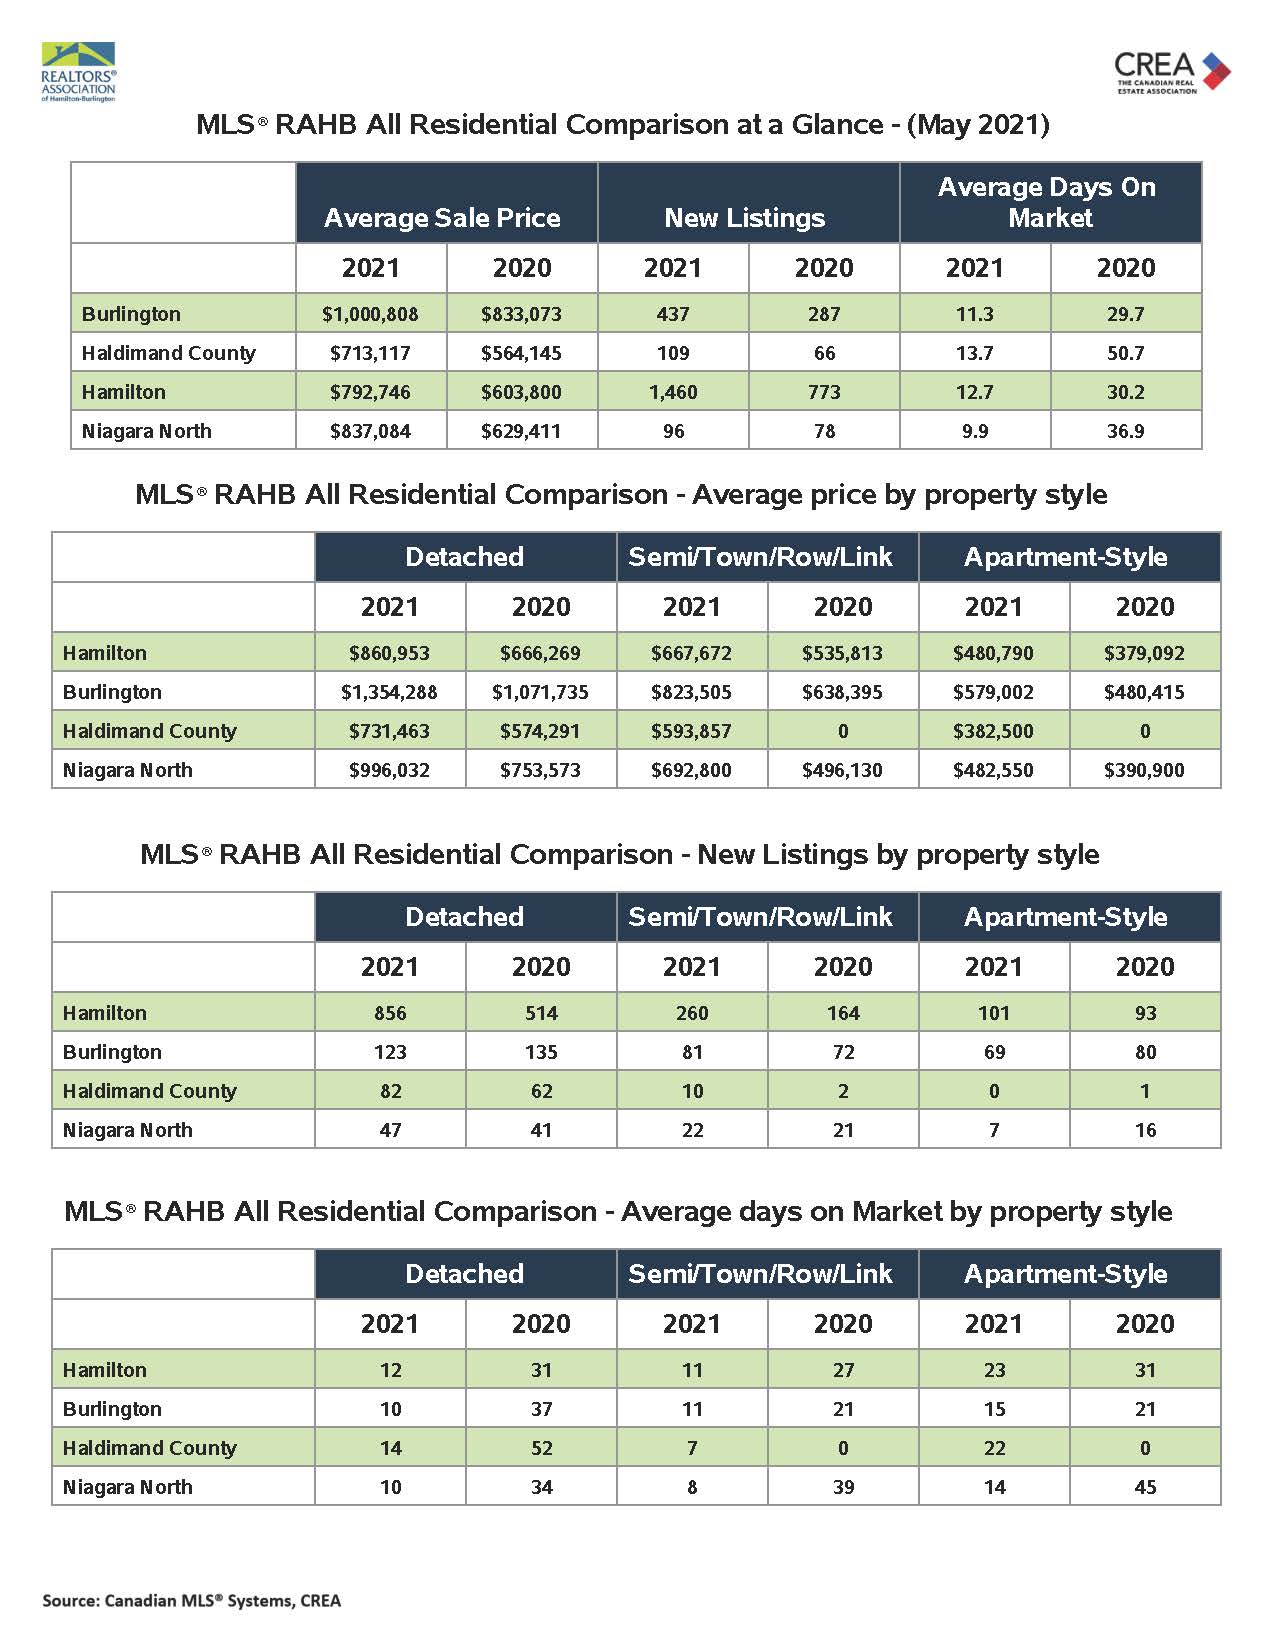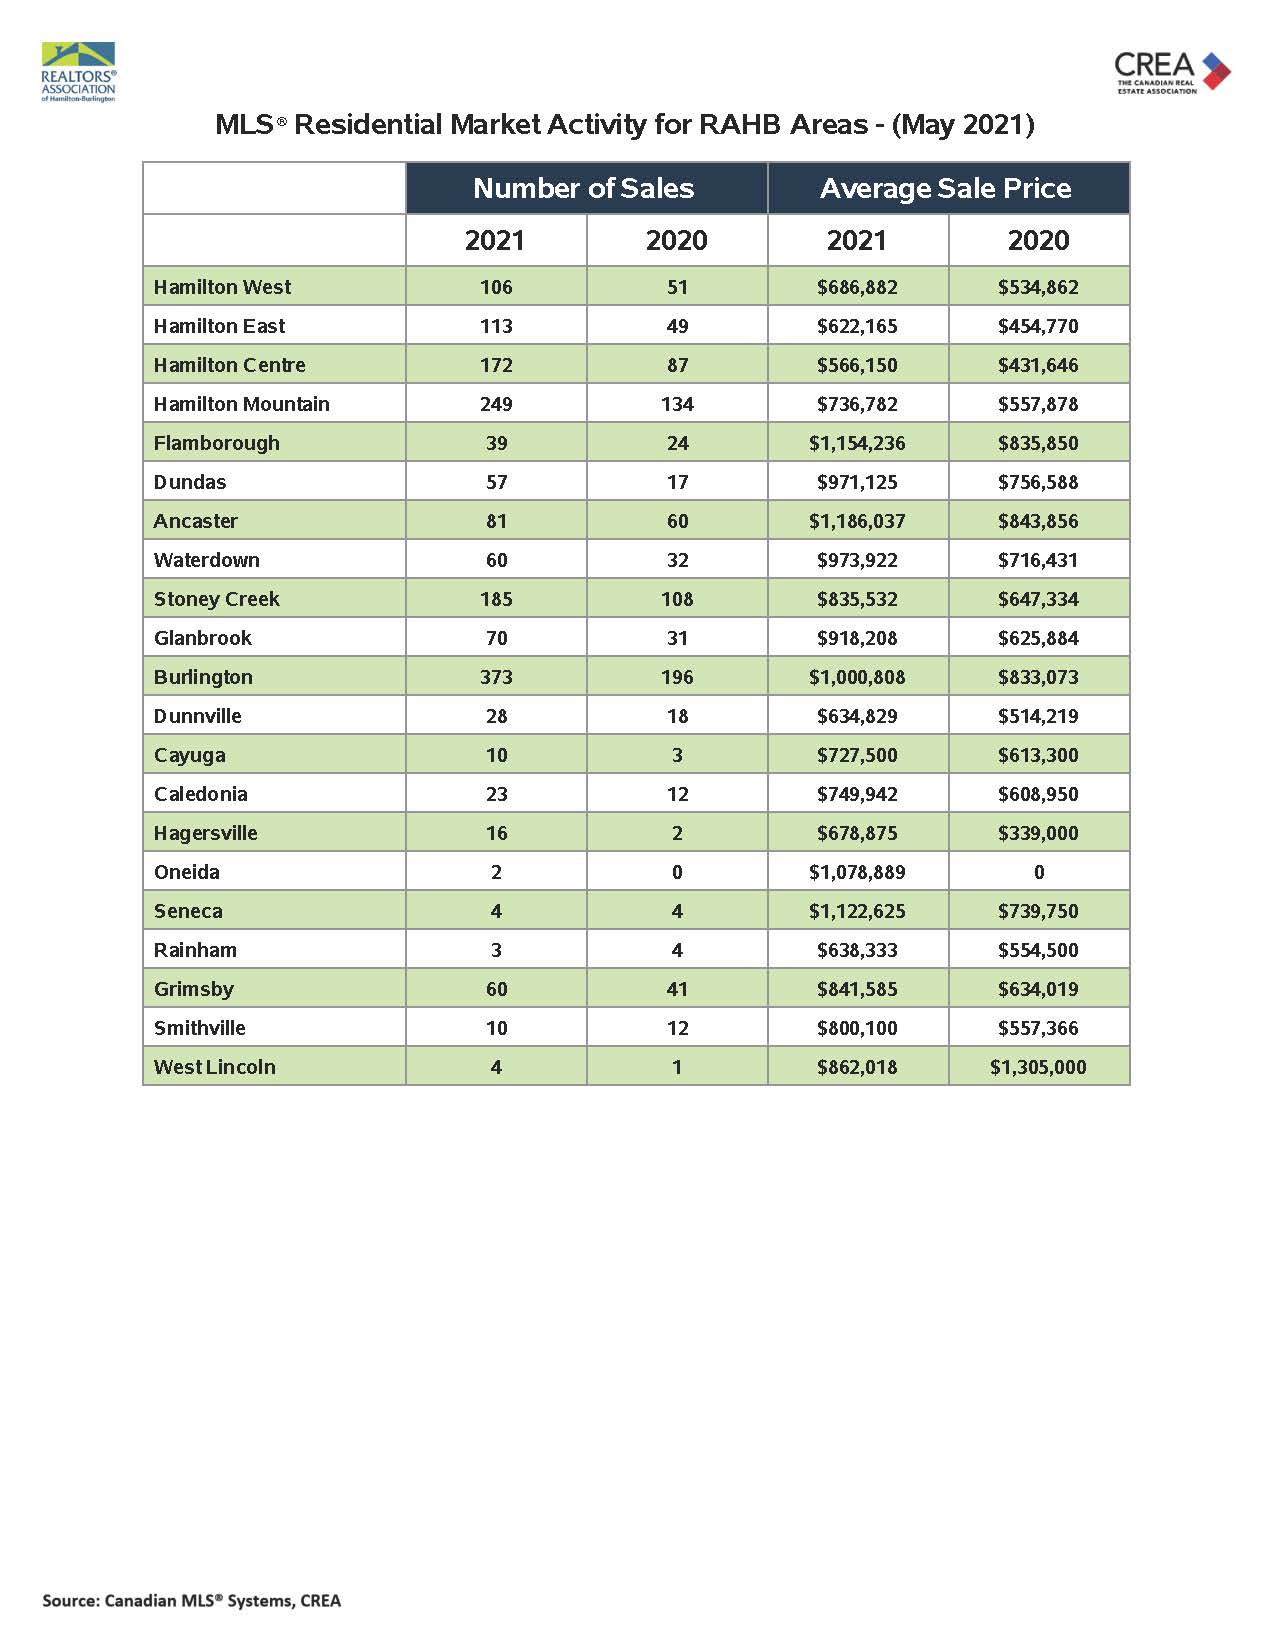
The REALTORS® Association of Hamilton-Burlington (RAHB) reported 1,811 sales of residential properties located within the RAHB market area through the Multiple Listing Service® (MLS®) System in May 2021. While sales were down five per cent since last month, they were up 90 per cent since May 2020. New listings were down 14 per cent since last month and up 73 per cent as of last May. The average price for residential properties was $843,468 which was down one per cent from last month and up 29 per cent from May 2020. The inventory available at the end of the month was 0.6 per cent lower than last month.
“In May 2021, the RAHB market area saw a very slight decrease in sales and number of properties being listed as compared to April 2021,” says RAHB President Donna Bacher.“We have to acknowledge that the impact of the COVID-19 pandemic distorts housing statistics when comparing year to year, so rather than looking at 2020 to 2021, our best insight comes from a month over month analysis – especially in a spring market.”

The number of sales of detached properties in the RAHB market area decreased by four per cent in May 2021 compared to April 2021. The number of new listings was down 12 per cent, and the average sale price decreased by one per cent to $940,348 from last month. The number of active listings for detached homes has increased by two per cent compared to April 2021. The sales to new listing ratio at the end of May was 77 per cent for detached properties.
“For the second month in a row, detached homes in the RAHB market area saw a slight decrease in average price even though statistically we are still well within a strong seller’s market,” says Bacher.

The number of sales of townhomes in the RAHB market area decreased by 10 per cent in May 2021 compared to April 2021. The number of new listings of townhomes was down 20 per cent, and the average sale price increased by 0.2 per cent to $714,695 from last month. The number of active listings for townhomes has decreased by nine per cent compared to April 2021. The sales to new listing ratio at the end of May was 85 per cent for townhomes.
“Townhomes, when comparing May 2021 to April 2021, saw an overall decrease in the number of sales, new listings, and active listings; however, the average price of a townhome remained practically the same compared to last month at just over $700,000. With a significant drop in new listings compared to last month it is no surprise that townhomes finished May off in a very strong seller’s market.”
The number of sales of apartment-style properties in the RAHB market area increased by four per cent in May 2021 compared to April 2021. Compared to last month, May 2021 saw the number of new apartment-style listings decrease by 12 per cent, and the average sale price decreased by 0.2 per cent to $532,030. The sales to new listing ratio at the end of May was 98 per cent for apartment-style properties.
“The average price of an apartment-style property saw a nominal decrease for May 2021. But once again, apartment-style properties finished the month in a very solid seller’s market.”

Specific neighbourhoods within the overall RAHB market area saw results that often differ from the average of the entire RAHB market area. Neighbourhoods vary and, determining the right price and conditions when buying or selling a property can be challenging. Local RAHB REALTORS® have the experience, knowledge and tools to help buyers and sellers make those big decisions.
Bacher adds, “For anyone who wants to buy or sell a home in the RAHB market area, our RAHB REALTORS® have access to the best technology, along with a commitment to follow strict safety protocols, ensuring safe and successful showings and sales. Whether you’re a buyer or seller, working with one of RAHB’s more than 3,500 members will help ensure you are not only getting the best service and data but also that your real estate transactions will be both successful and safe.”
**Average sale price can be useful in establishing long-term trends but should not be used as an indicator that specific properties have increased or decreased in value. Talk to your local REALTOR®.
Follow the links below for:
- Residential Market Activity for RAHB Area
- RAHB Residential Market At A Glance
- RAHB Residential Activity Map
- Residential Market Activity Table for Burlington
- Residential Market Activity Table for Hamilton
- Residential Market Activity Table for Haldimand
- Residential Market Activity Table for Niagara North
- Commercial Market Activity Table for RAHB Areas

