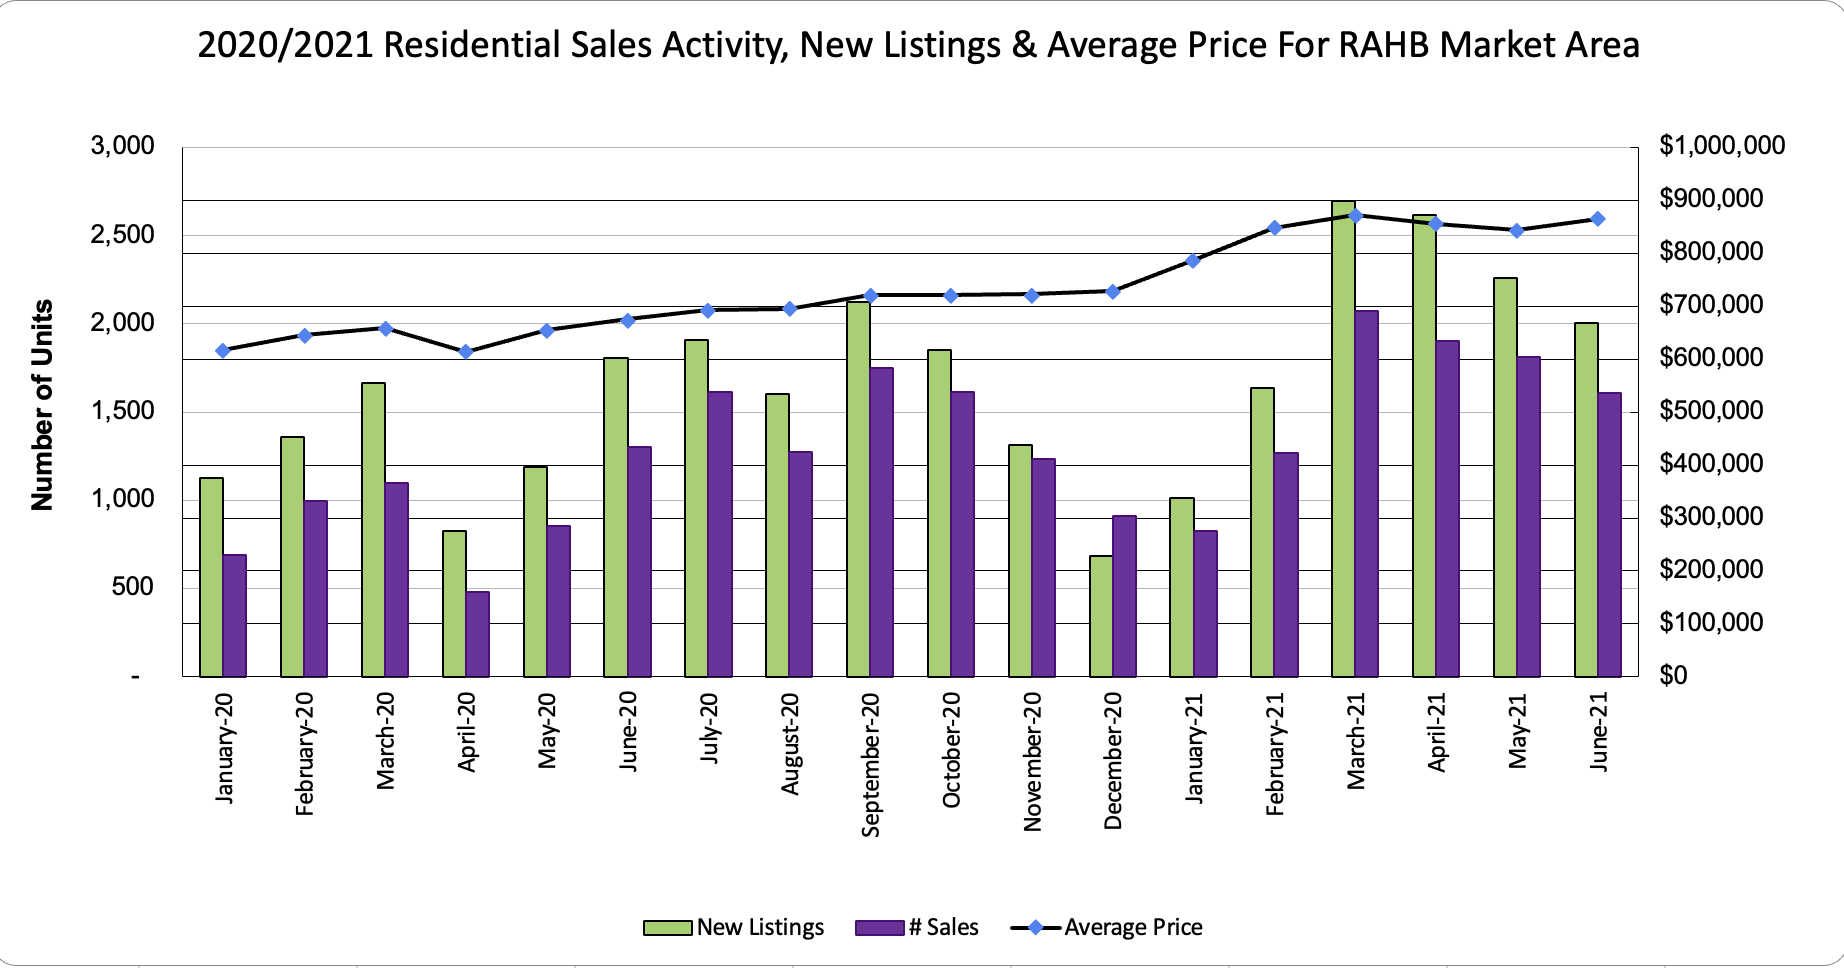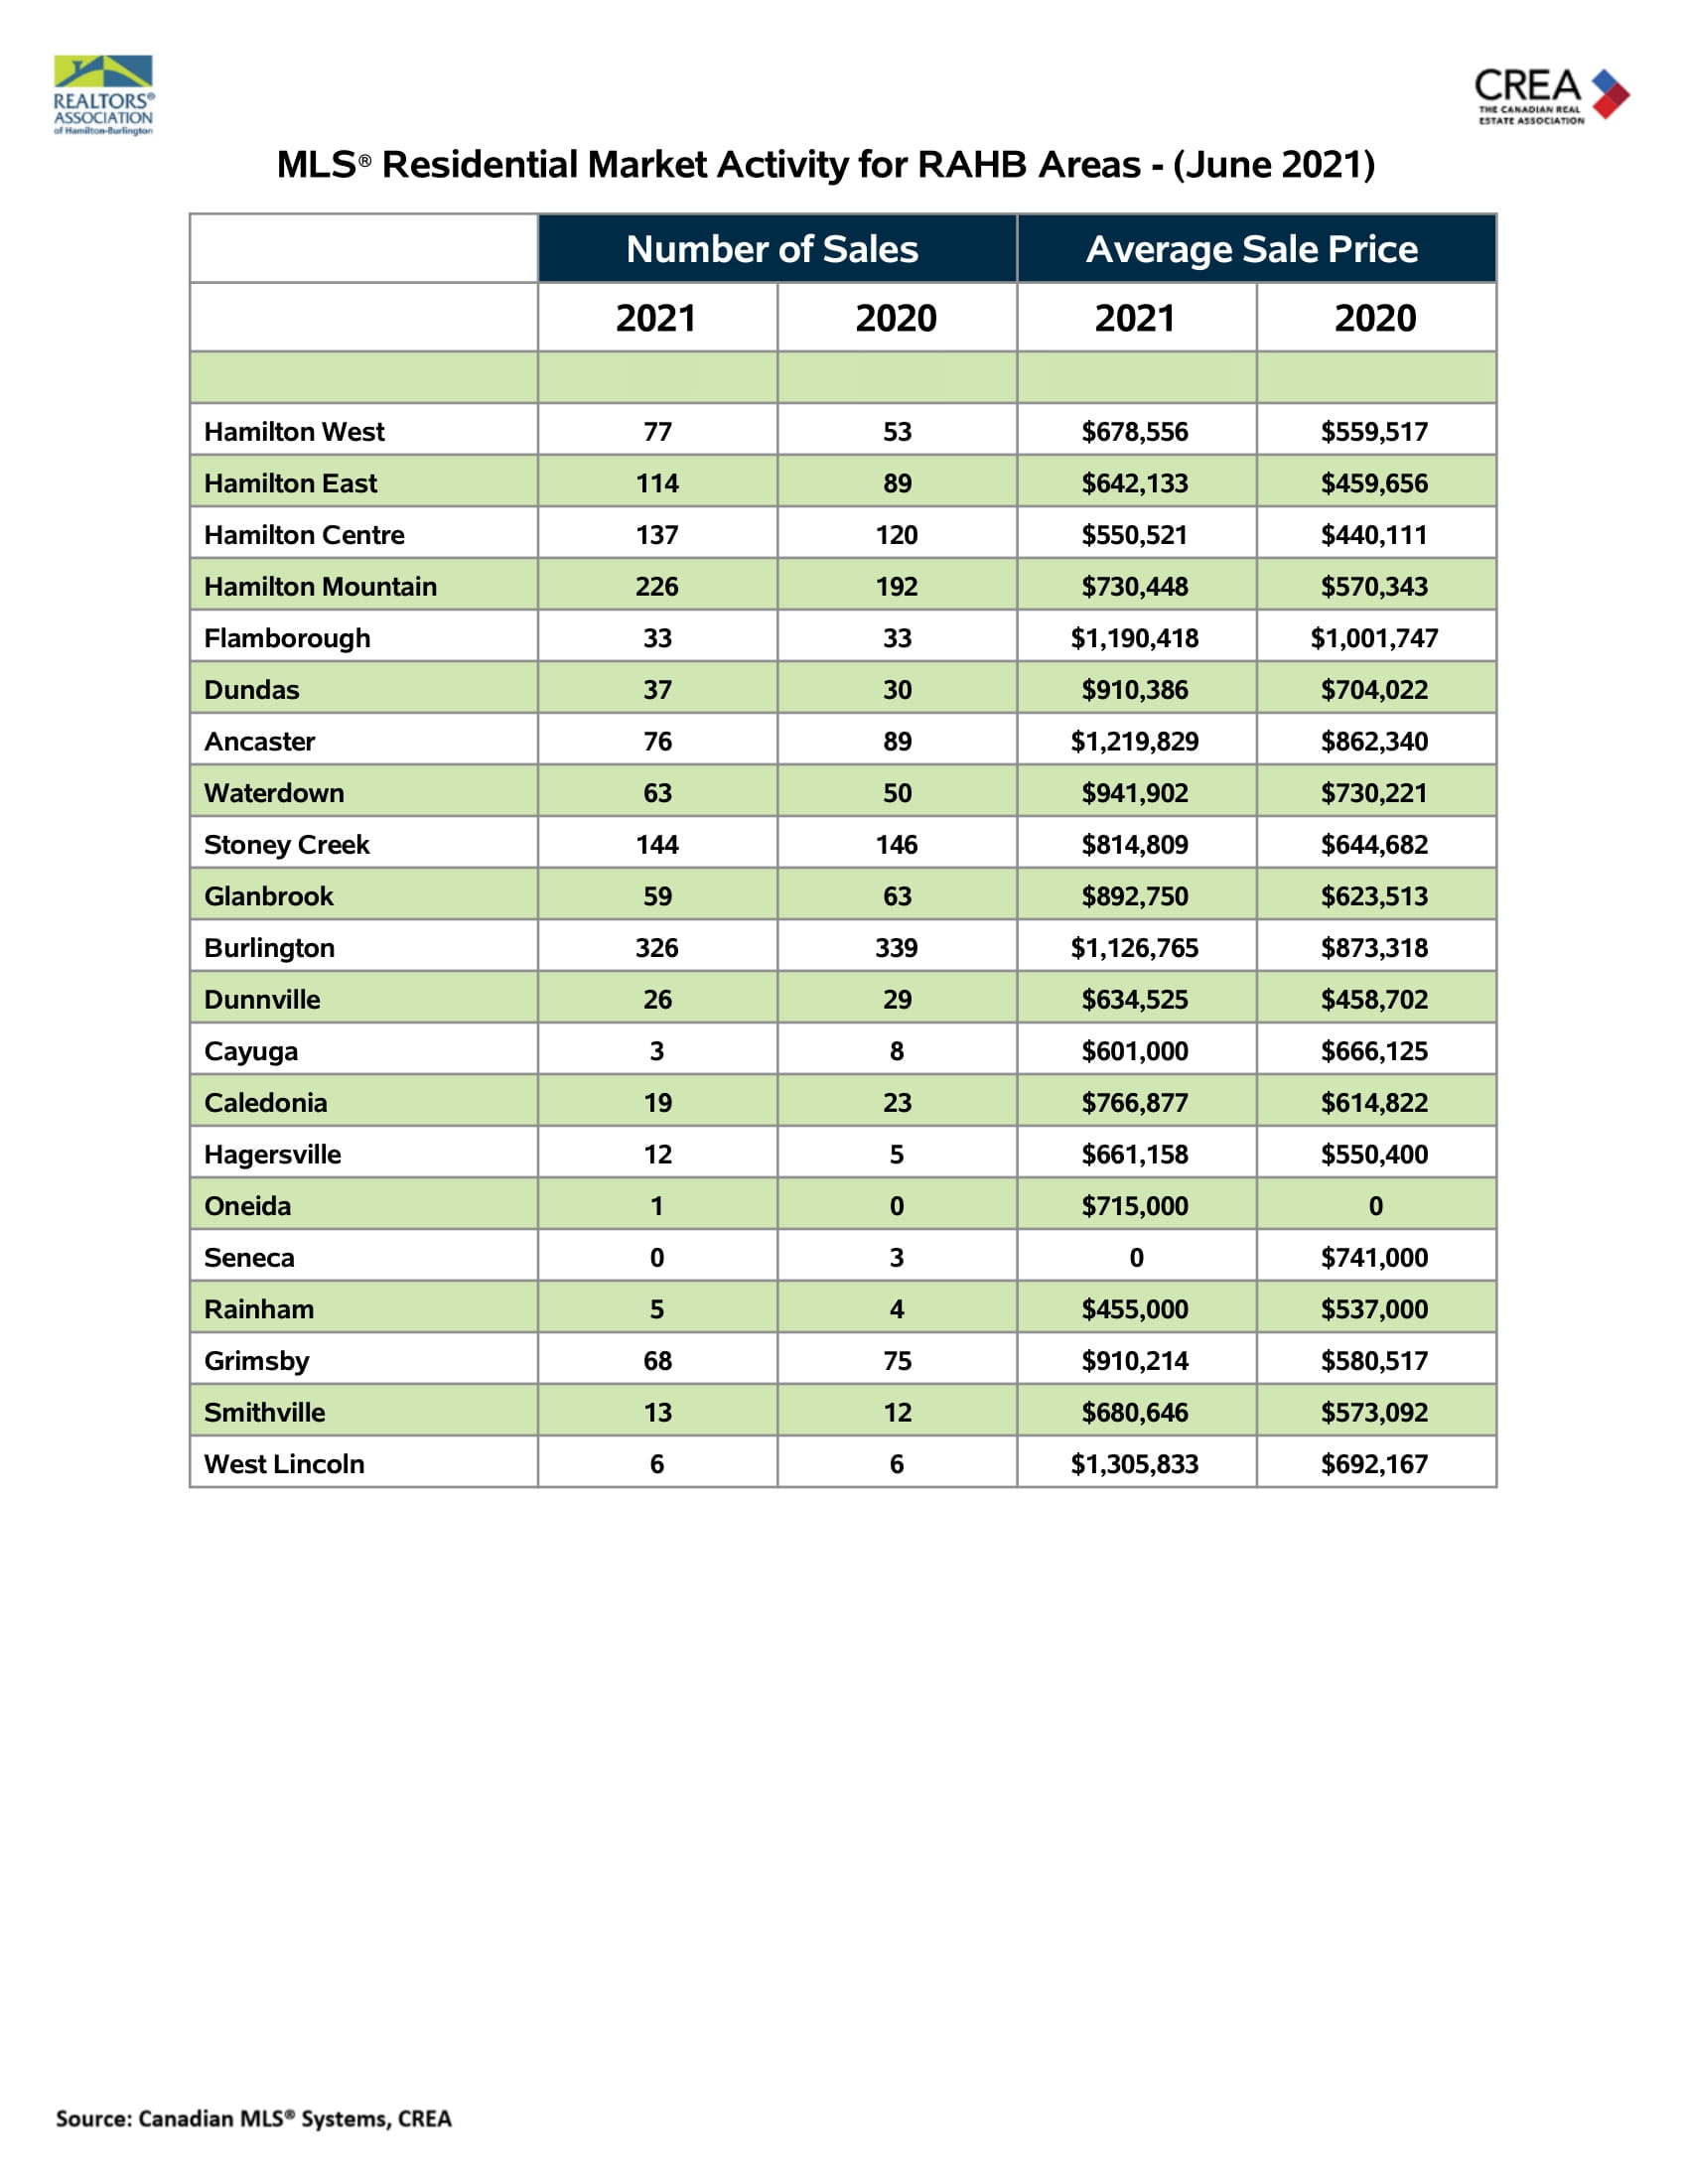
Hamilton, ON (July 6, 2021) – The number of homes sold through the MLS ® System of the REALTORS ® Association of Hamilton-Burlington (RAHB) totaled 1,607 units in June 2021. This was an advance of nearly 10 per cent from June 2020.
Home sales were 14 per cent above the five-year average and 11 per cent above the 10-year average for the month of June.
On a year-to-date basis, home sales totaled a record 9,518 units over the first six months of the year. This was up sharply by 57 per cent from the same period in 2020.
“June’s home sales marked one of the strongest levels on record for this month. Year-over-year gains are expected to become more modest and may even be negative in the months ahead as we reach a crossover period where sales in 2020 roared back to life and sales this year are cooling off after a blistering pace,” said Donna Bacher, President of the REALTORS ® Association of Hamilton-Burlington. “With new listings only back around average levels this has done nothing to lift overall inventories from record lows. While market conditions remain historically tight with demand far outpacing supply, we are seeing average sale prices remain stable.”

The MLS ® Home Price Index (HPI) tracks price trends far more accurately than is possible using average or median price measures. The overall MLS ® HPI composite benchmark price was $879,100 in June 2021, a significant increase of 28 per cent compared to June 2020.
The benchmark price for single-family homes was $932,700, a notable gain of 30 per cent on a year-over-year basis in June. By comparison, the benchmark price for townhouse/row units was $672,300, rising 26 per cent compared to a year earlier, while the benchmark apartment price was $552,900, up 19 per cent from year-ago levels.

The average price of homes sold in June 2021 was $865,339, an increase of 27 per cent from June 2020.
The more comprehensive year-to-date average price was $852,035, advancing 30 per cent from the first six months of 2020.
The dollar value of all home sales in June 2021 was $1.4 billion, up 39 per cent from the same month in 2020. This was also a new record for the month of June.
The number of new listings edged up only one per cent from June 2020. There were 2,005 new residential listings in June 2021.
New listings were five per cent below the five-year average and short of one per cent above the 10-year average for the month of June.
Active residential listings numbered 1,219 units on the market at the end of June, down sharply by 33 percent from the end of June 2020. Active listings haven’t been this low in the month of June in more than three decades.
Active listings were 48 per cent below the five-year average and 52 per cent below the 10-year average for the month of June.
Months of inventory numbered 0.8 at the end of June 2021, down from the 1.3 months recorded at the end of June 2020 and below the long-run average of 1.9 months for this time of year. The number of months of inventory is the number of months it would take to sell current inventories at the current rate of sales activity.

Specific neighbourhoods within the overall RAHB market area saw results that often differ from the average of the entire RAHB market area. Neighbourhoods vary and, determining the right price and conditions when buying or selling a property can be challenging. Local RAHB REALTORS® have the experience, knowledge and tools to help buyers and sellers make those big decisions.
Bacher adds, “For anyone who wants to buy or sell a home in the RAHB market area, our RAHB REALTORS® have access to the best technology, along with a commitment to follow strict safety protocols, ensuring safe and successful showings and sales. Whether you’re a buyer or seller, working with one of RAHB’s more than 3,500 members will help ensure you are not only getting the best service and data, but also that your real estate transactions will be both successful and safe.”
**Average sale price can be useful in establishing long-term trends but should not be used as an indicator that specific properties have increased or decreased in value. Talk to your local REALTOR®.
Follow the links below for:
- Residential Market Activity for RAHB Area
- RAHB Residential Market At A Glance
- RAHB Residential Activity Map
- Residential Market Activity Table for Burlington
- Residential Market Activity Table for Hamilton
- Residential Market Activity Table for Haldimand
- Residential Market Activity Table for Niagara North
- Commercial Market Activity Table for RAHB Areas

