Hamilton, ON (April 2, 2020) – The REALTORS® Association of Hamilton-Burlington (RAHB) reported 1,098 sales of residential properties located within the RAHB market area were processed through the Multiple Listing Service® (MLS®) System in March 2020. Sales are up 10 per cent over last month, but down 3.1 per cent over March 2019. The average price for residential properties increased to $658,161, which is up 1.8 per cent from last month and up 14.5 per cent from the same month last year.
“January and February saw increases in sales and new listings, as well as average price. For March there was growth at the beginning of the month; however, COVID-19 infiltrated our communities mid-month and slowed activity in the latter half,” says RAHB President Kathy Della-Nebbia. “Our REALTORS® work to be a part of the solution in the fight to flatten the curve, all the while servicing clients who are in great need of their assistance. We are seeing the impact on our market activity and expect to continue to see a slowing of the market as our communities focus on this unprecedented fight.”
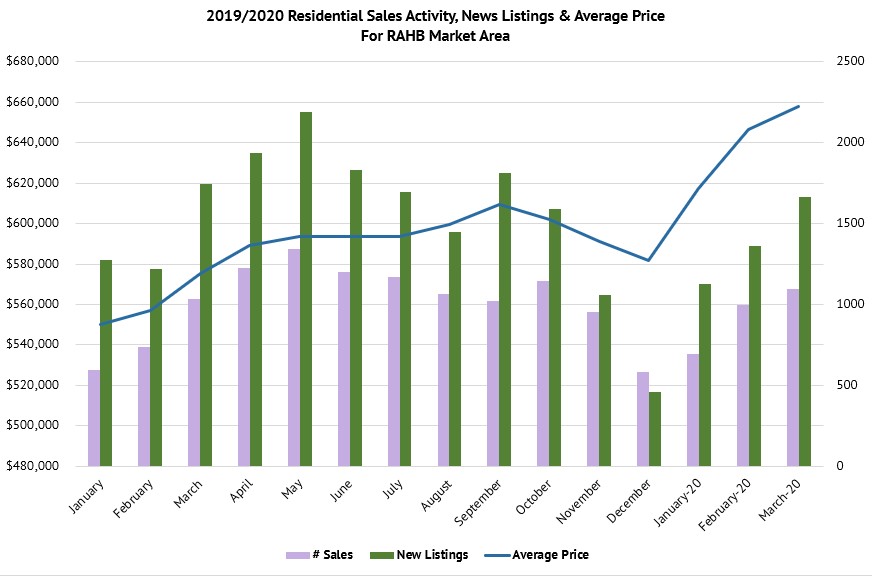
The number of sales for single family properties within the entire RAHB market decreased by 1.9 per cent compared to the same month last year, and the average sale price increased by 14.3 per cent. Townhouse sales activity across the entire RAHB market area decreased from March 2019 by 5.7 per cent, and the average townhouse sale price increased by 14.9 per cent to $562,336. Apartment-style property sales decreased by 11.9 per cent from March 2019, and the average price increased by 14.5 per cent.
“New listings and sales have been affected by the onset of COVID-19, but the average price continues to increase. We will have to wait for the April data to see the full impact on our market area,” says RAHB CEO Carol Ann Burrell. “RAHB REALTORS® are working virtually as much as possible to do their part to slow the spread of COVID-19, and are embracing technology to work with clients and close transactions remotely. If you are using a local RAHB REALTOR®, they are well-equipped to complete your property transaction during this uncertain time.”
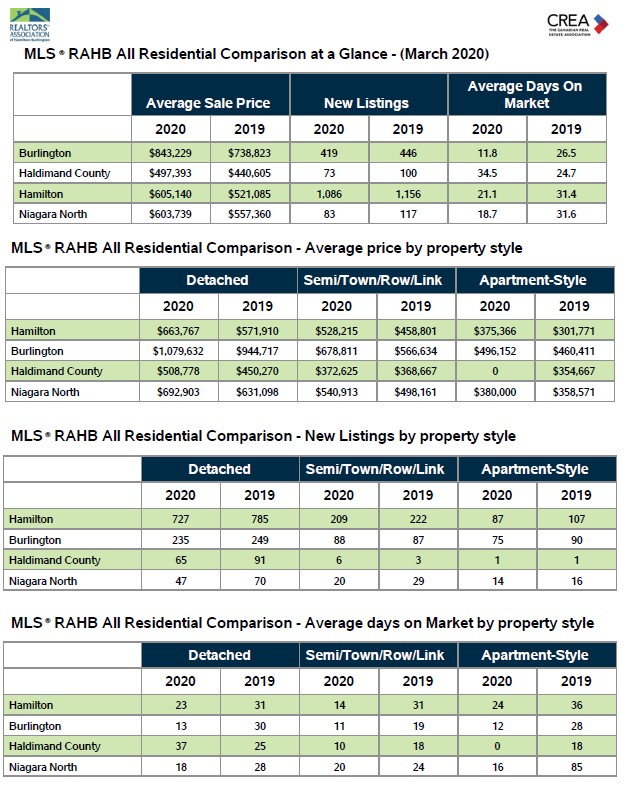
Specific neighbourhoods within the overall RAHB market area see results that often differ from the average of the entire RAHB market area. Because neighbourhoods vary, determining the right price and conditions when buying or selling a property can be challenging. Local RAHB REALTORS® have the experience, knowledge and tools to help buyers and sellers make those big decisions.
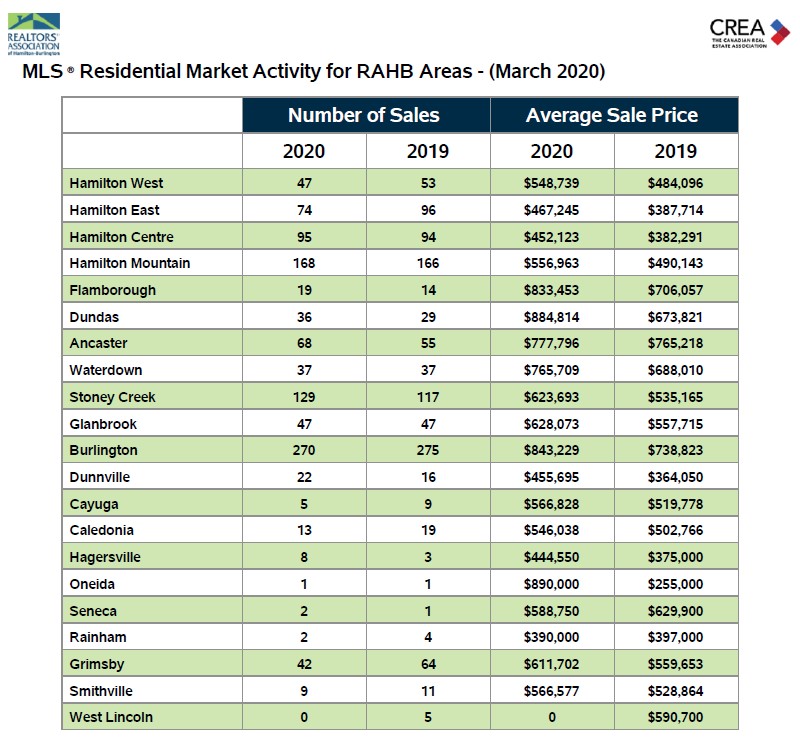
Please follow the links below for:
- Residential Market Activity Table for RAHB Areas
- RAHB Residential Activity Map
- Residential Market Activity Table for Burlington
- Residential Market Activity Table for Hamilton
- Residential Market Activity Table for Haldimand
- Residential Market Activity Table for Niagara North
- Commercial Market Activity Table for RAHB Areas
*Average sale price can be useful in establishing long-term trends, but should not be used as an indicator that specific properties have increased or decreased in value. Talk to your local REALTOR®.
*Please note: The overall RAHB residential average price is calculated by dividing the sum of all residential sale prices by the total number of residential sales.

